Utilization Trend Summary
The Utilization and Trend Summary shows a trend for performance and capacity across all business unit metrics.
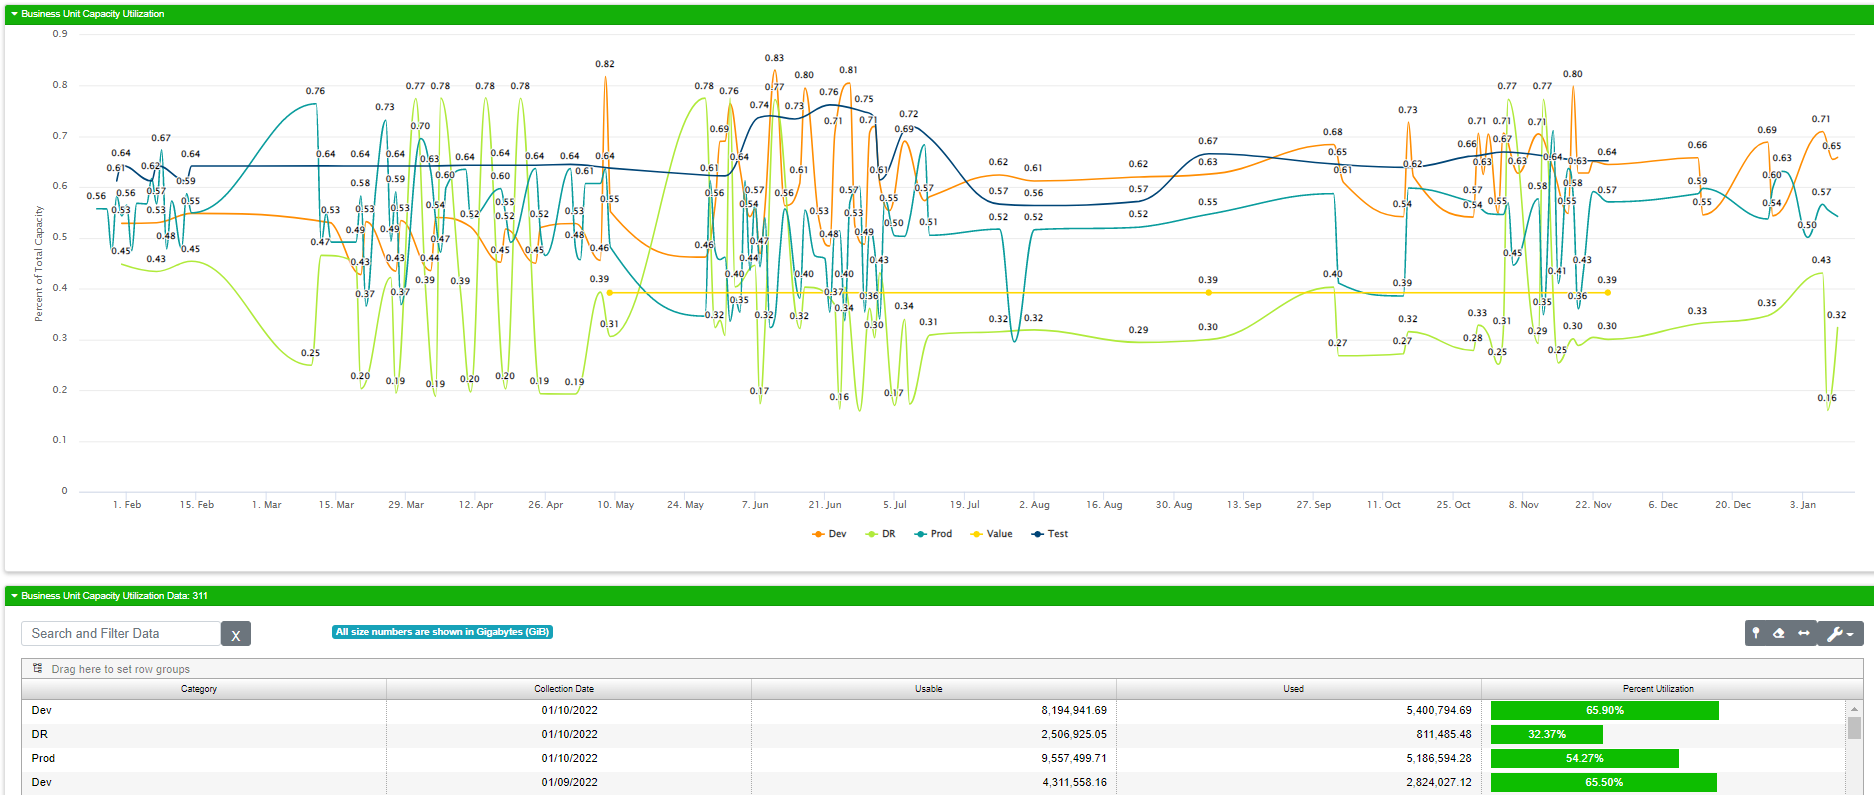
Capacity Utilization
This report shows the percentage trend of capacity utilization across categories. The colors on the graph are random given every organization has different categories.
Field |
What It Means |
|---|---|
Category |
The category for this line of data |
Collection Date |
The date the data were collected |
Usable |
The usable storage for this array (usable = raw - overhead) |
Used |
The amount of space used |
Percent Utilization |
The percentage of the usable storage consumed. The bar graph shows this statistic for the related collection date. |
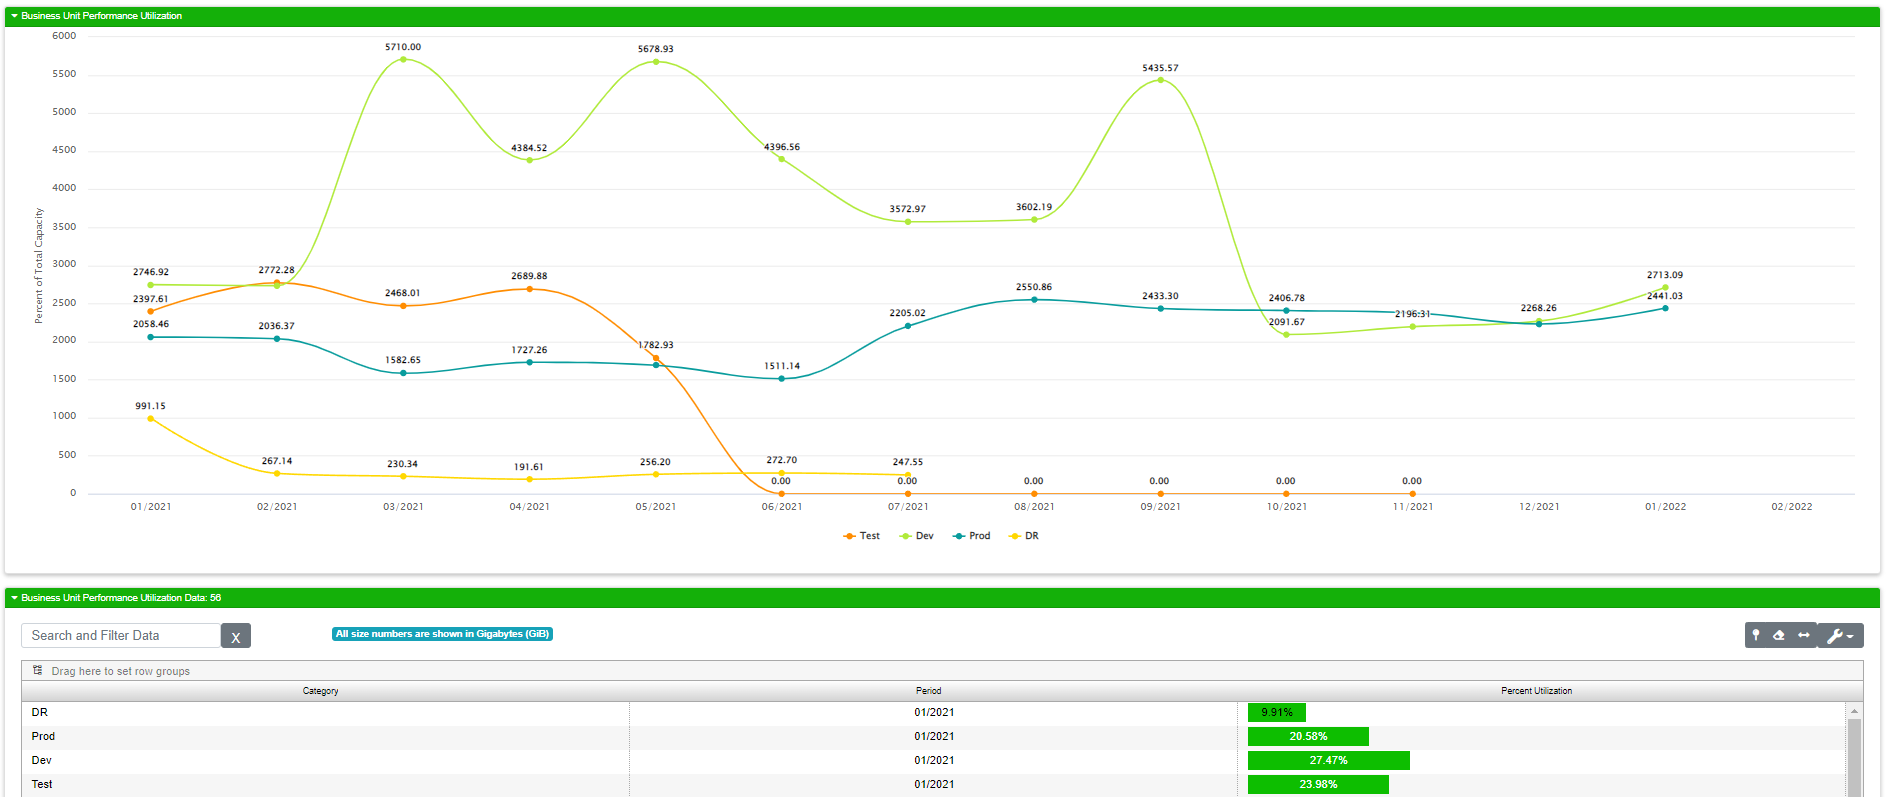
Performance Utilization
This report shows the percentage trend of performance utilization across categories. The colors on the graph are random given every organization has different categories.
Field |
What It Means |
|---|---|
Category |
THe name of the category for this line of dat |
Period |
The month / year for the collected data |
Percent Utilization |
The percentage of available performance capacity used by the category |