Health Reports in VSI give you an easily scannable view of the over health of your enterprise storage infrastructure. The reports use consistent iconography.
Icon |
What It Means |
|---|---|

|
The red bell indicates an alert. We’ve flagged this as an important warning based on storage industry best practices. |

|
The yellow triangle indicates a warning. It’s not a serious issue, but it could become one soon. |

|
The green checkmark indicates all is well. It’s a beautiful day at Visual Storage Intelligence. |
If you’d rather we not bother you with good news, check out the Enterprise Red Light report and the Enterprise Yellow Light report documented below. At the enterprise level, you can double click any report row on a health report to switch to the detail view.
Enterprise Health
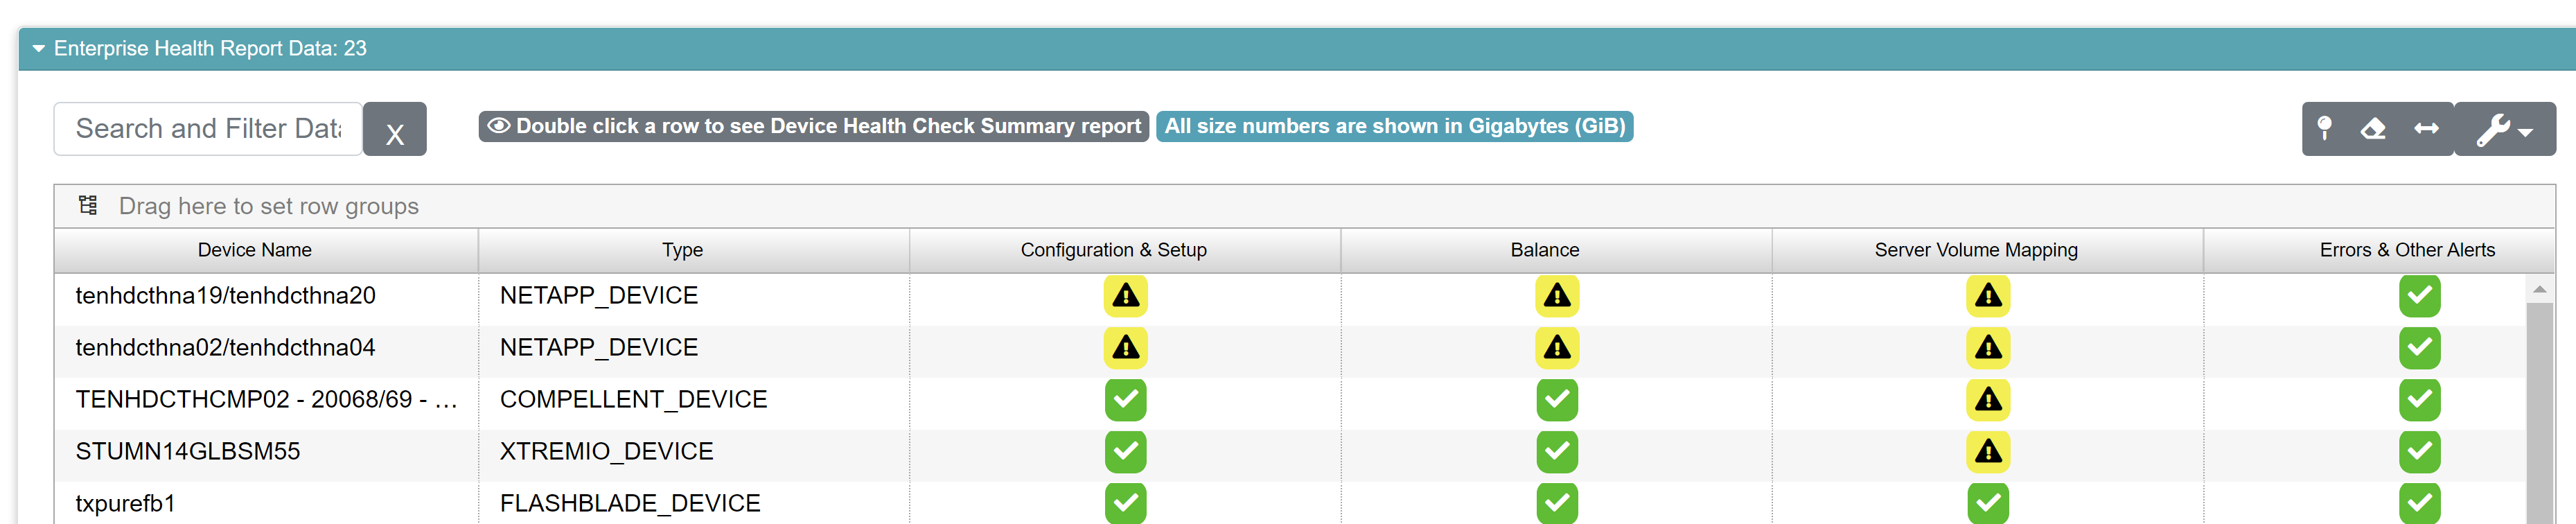
The Enterprise Health report provides the client a dashboard-type indicator to highlight any device that is approaching or reached thresholds that need to be addressed. If you would like more details on a particular system, double-click the row and you’ll be taken to the device level health summary specific to that device.
Field |
What It Means |
|---|---|
Device Name |
Individual device name (Hint: to access the detailed device report, simply double click the device name) |
Device Type |
Name of the device hardware |
Configuration & Setup |
Configuration rules violated (i.e. failed drives and hot spares) |
Balance |
Even balance allowances within 15% |
Server Volume Mapping |
Current state of orphaned volumes and hosts without storage mapped |
Errors & Other Alerts |
Other miscellaneous error reports |
Storage Layout |
Storage pool layout |
Volumes / Snapshots |
Snapshot analysis of how much space is stored for snaps and how many snaps |
Red Light Report
Our Enterprise Health report is designed to show you an overview of your storage system’s health across your enterprise IT assets. Our aim is to show you the good, the bad and the ugly. If you’re not a fan of the good and you want to go straight to what’s bad, we’ve got you. Check out the Red Light Report.
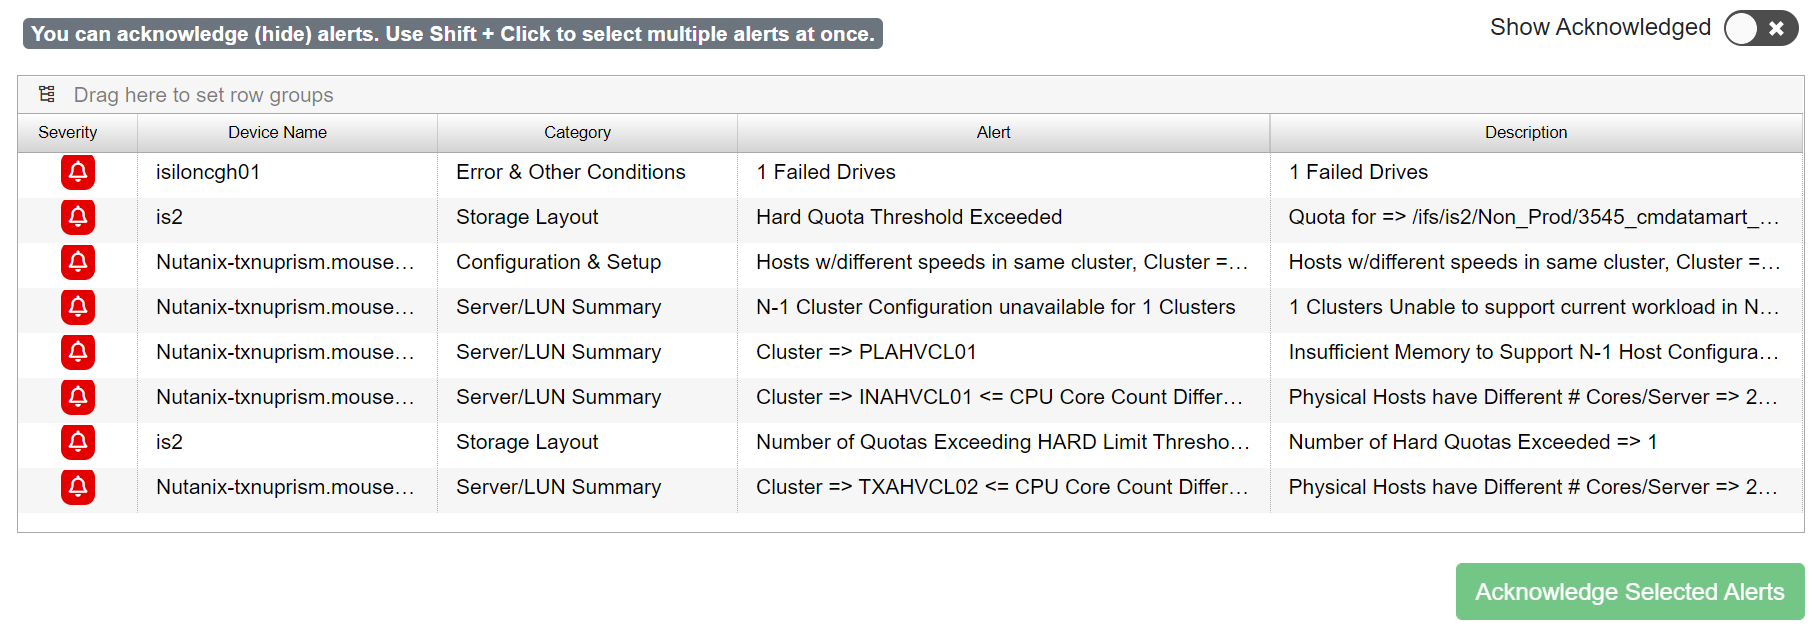
At some point, we’re bound to show you an alert you already know about. Maybe it’s something that doesn’t matter in your environment for any given reason. You have the ability to turn those alerts off by acknowledging them. Acknowledged alerts do not show up for the current collection date’s data (the data you are viewing right now), nor does it appear on future collections. To be clear, the alerts are there, they are simply hidden.
You can acknowledge (hide) alerts by clicking them, then clicking the Acknowledge Selected Alerts button at the bottom of the screen. Once acknowledged you will not see them again on the health reports.
When you acknowledge (hide) an alert, it is hidden for all users at your organization, not just you.
At the top of the report you have the ability to toggle whether or not you can see previously acknowledged alerts. By default, the switch is off and we’re hiding them. If you’d like to see your acknowledged alerts, click the switch to turn the visibility back on.
When the Show Acknowledged switch is on, you can see the hidden alerts and if you like, you can select them and Un-Acknowledge any alerts you’d like to see again. Basically, you’re un-hiding them.
If there are a lot of alerts to acknowledge or un-acknowledge you can click the first you’d like to work with, then hold down SHIFT on your keyboard and click to select the remaining alerts to work with.
Field |
What it Means |
|---|---|
Severity |
On the red light report, all these are going to be red. That seems obvious, right? 🤓 |
Device Name |
The name of the device. |
Category |
VSI makes recommendations in 5 categories. This field lists the category for the alert. You can drag this column to the top of the grid to group by the field and see each category with a list of those types of alerts in the group. |
Alert |
This field explains why the alert was flagged |
Description |
This field gives more information on why the alert is important. |
If you’re interested in the best practices we use to determine what shows up as an alert, check out our documentation on storage health.
Yellow Light Report
This is the same report as the Enterprise Red Light Report 👆, except that it only shows yellow light warnings. Yellow warnings usually indicate something is trending towards becoming a red light. We want you to be prepared for any problems in advance, so we discourage ignoring these alerts.
Coming Soon: ServiceNow Integration
Your red and yellow alerts can be exported as tickets to ServiceNow. We support two levels of integration: Manual and Automatic. If you’re account is set up for automatic ServiceNow integration, you’ll see a badge at the top of the report indicating that un-acknowledged alerts have been added to Service Now.
For manually sending the alert as an issue in Service Now, the workflow is similar to the process for acknowledging alerts. Select the issues you’d like to send to Service Now and click the Export to Service Now button.