The first two business unit performance trend reports follow the same conventions found in Enterprise Summary trend reports. The difference is business unit trend reports will contain some element related to your business unit data rather than simply being all about storage. These reports can help you align your storage performance with your strategic business objectives.
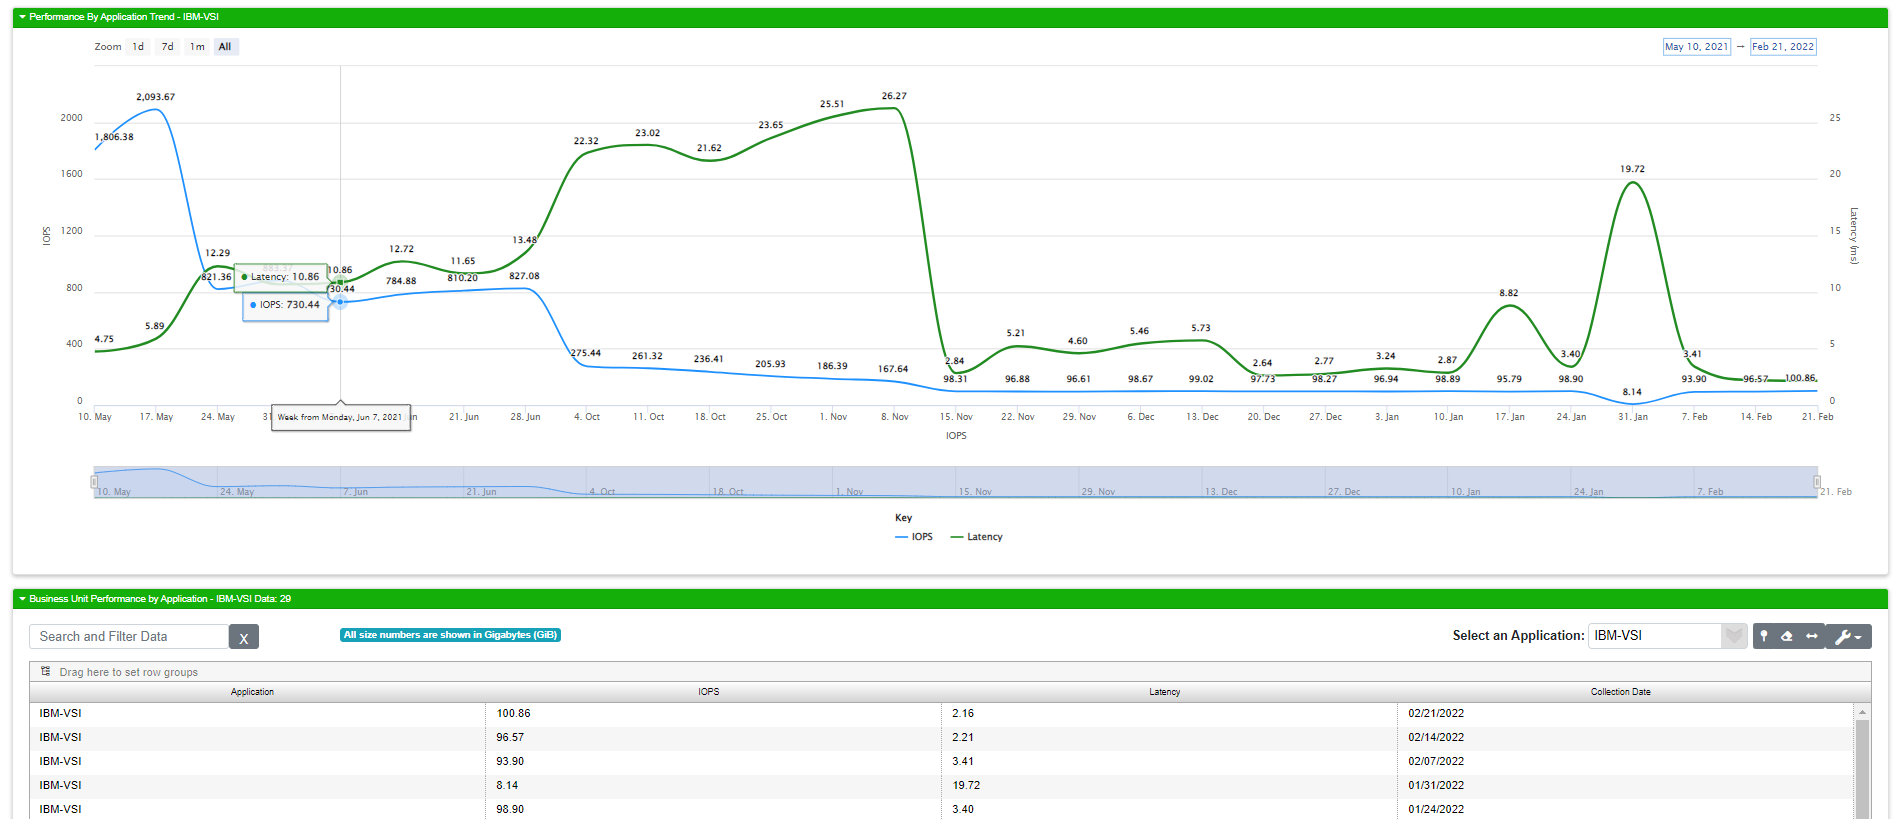
As with the Enterprise Performance trend reports, the graphs often show the two most important measures of storage performance: IOPS and Latency. Of the two, latency is more important since it tells you how long each I/O operation takes as opposed to simply telling you how many occur per second. It’s best to present these numbers together because IOPs by itself doesn’t tell you much about actual performance. Our graphs have two y-axes. On the left side 👈, you’ll find IOPS and on the right 👉, you'll find latency. The color-coded lines on the graph are consistently the same color as you move between the graphs that share this format. IOPS is always rendered in blue while latency always appears as a green line.
Application Trends
The Application Trends report allows you to see how your applications are performing with respect to storage.
Field |
What It Means |
|---|---|
Application |
The name of the application |
IOPS |
Input / Output Operations Per Second reveals how many operations occurred per second at the time of collection |
Latency |
The measure of time consumed by a single I/O operation expressed in milliseconds |
Collection Date |
The date this data was collected. |
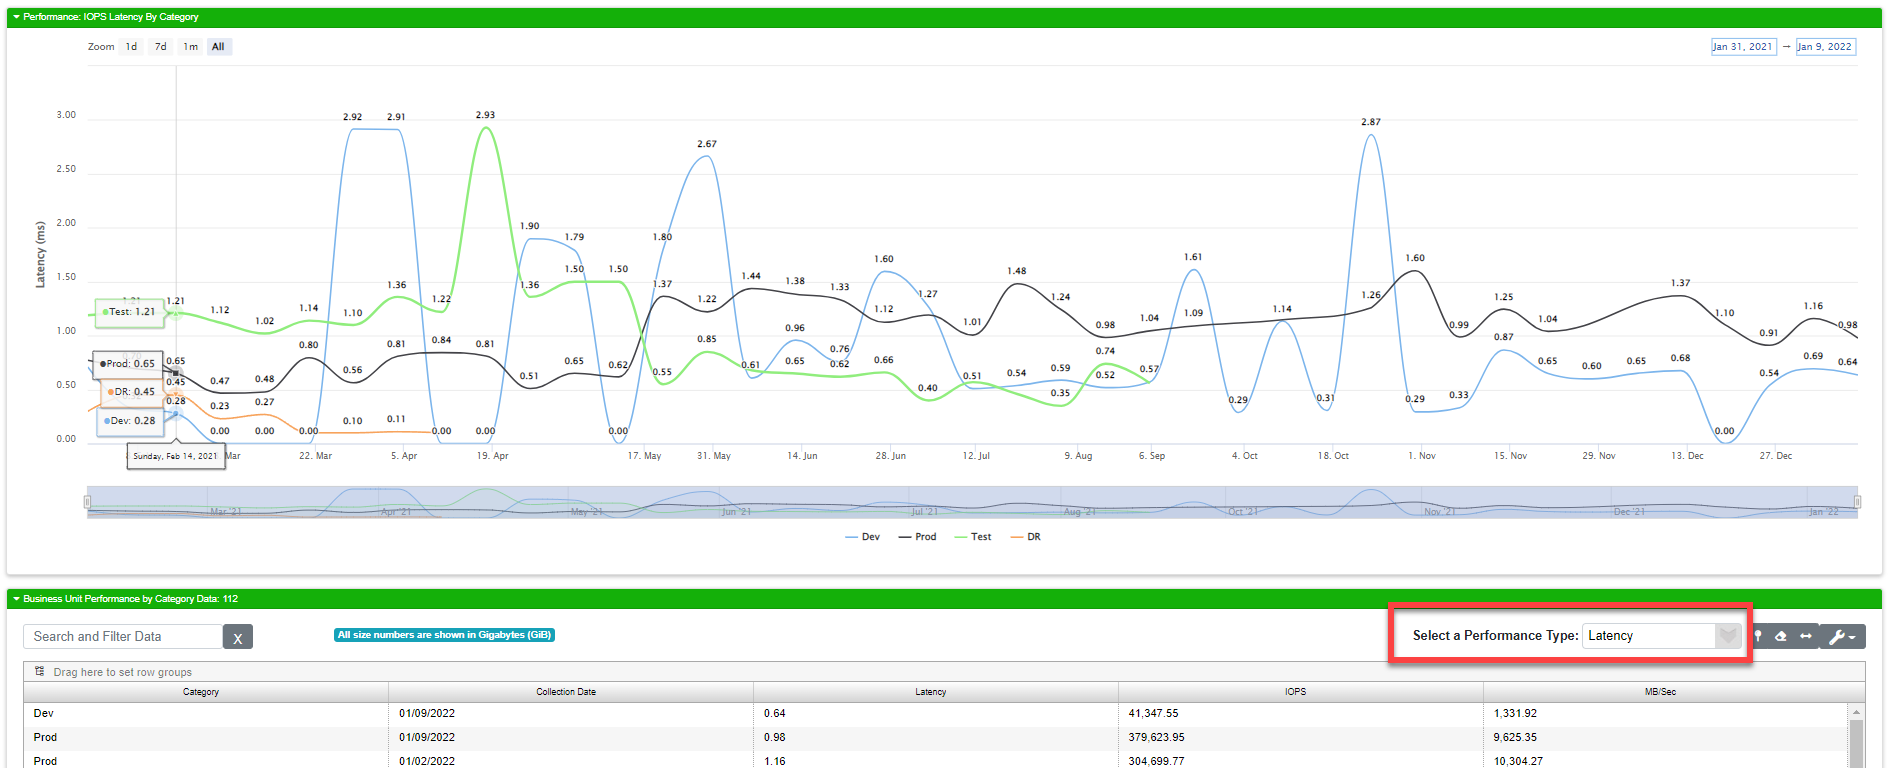
Category Trends
The Category Trends report is similar to the Application Trends report (above) but focuses on categories rather than applications.
Field |
What It Means |
|---|---|
Category |
The name of the category |
IOPS |
Input / Output Operations Per Second reveals how many operations occurred per second at the time of collection |
Latency |
The measure of time consumed by a single I/O operation expressed in milliseconds |
Collection Date |
The date this data was collected. |
Summary Report
Documentation coming soon!
Detail Report
Documentation coming soon!
All Category Trends
The All Category Trends report shows you IOPS, latency, and megabytes per second (MB/S) trends separately based on category. The colors in this graph are random since every organization will have different categories. You can change which statistic you’re viewing using the Select a Performance Type drop-down just above the customizable data grid.
Field |
What It Means |
|---|---|
Category |
The category for this line of data |
Collection Date |
The date this particular set of data were collected |
Latency |
The measure of how fast a single I/O operation takes for the storage under review at the time of collection |
IOPS |
The number of Input / Output Operations per Second for the storage under review at the time of collection |
MB/Sec |
Megabytes per Second is a measure of total throughput. It shows how much data is moving to or from storage per second |
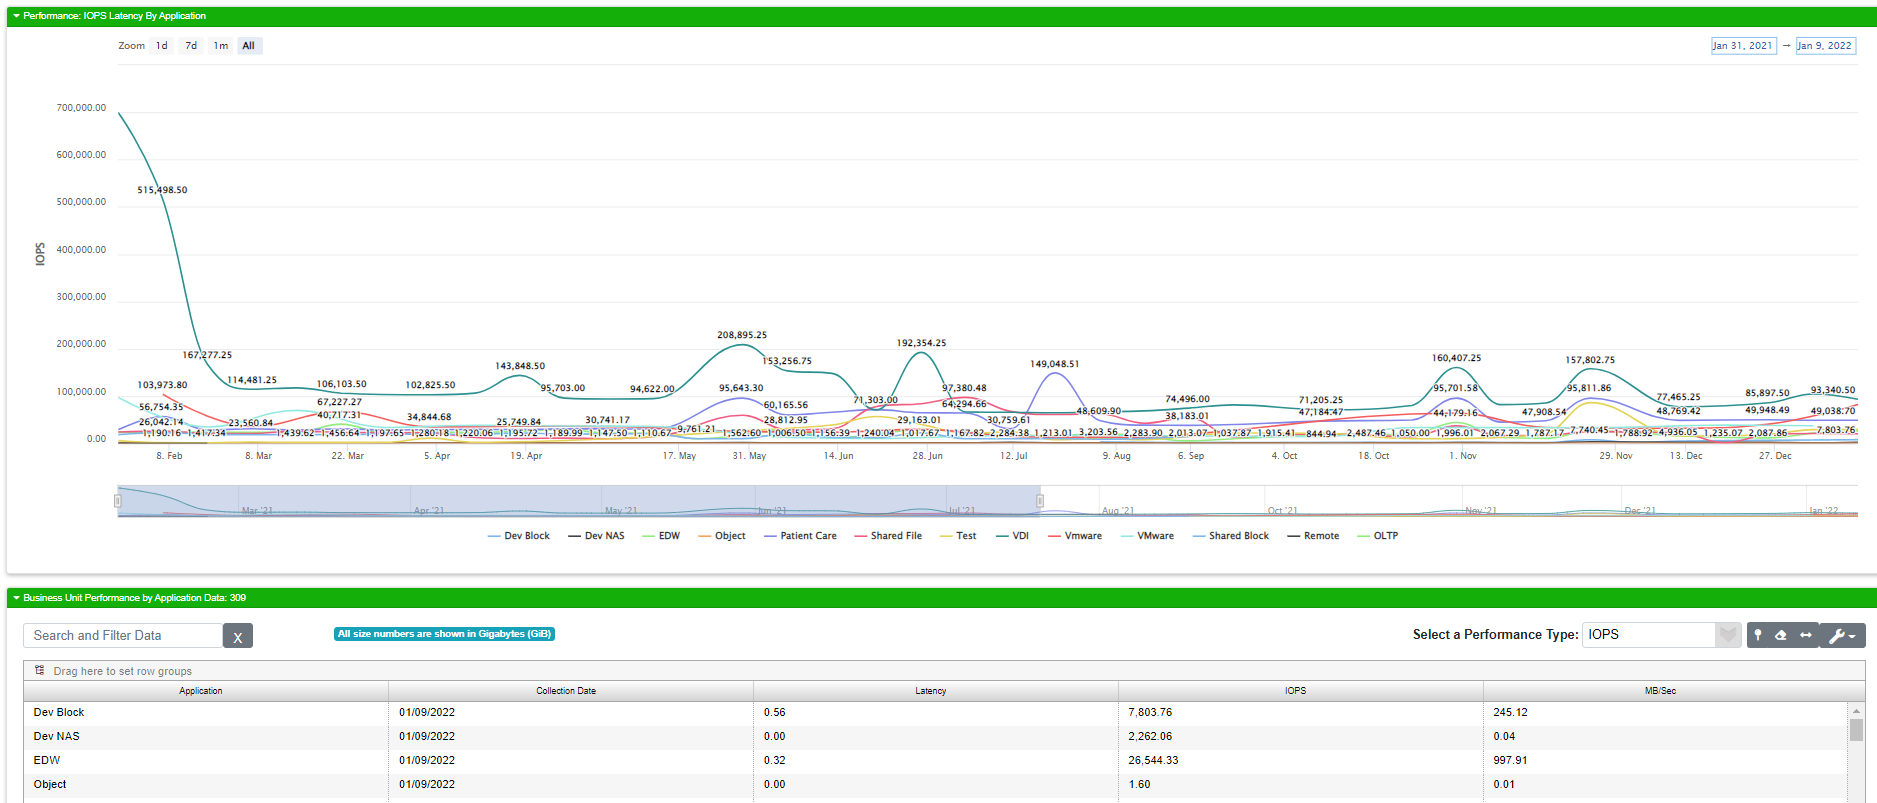
All Application Trends
The All Category Trends report shows you IOPS, latency, and megabytes per second (MB/S) trends separately based on application. The colors in this graph are random since every organization will have different applications. You can change which statistic you’re viewing using the Select a Performance Type drop-down just above the customizable data grid.
Field |
What It Means |
|---|---|
Application |
The application for this line of data |
Collection Date |
The date this particular set of data were collected |
Latency |
The measure of how fast a single I/O operation takes for the storage under review at the time of collection |
IOPS |
The number of Input / Output Operations per Second for the storage under review at the time of collection |
MB/Sec |
Megabytes per Second is a measure of total throughput. It shows how much data is moving to or from storage per second |