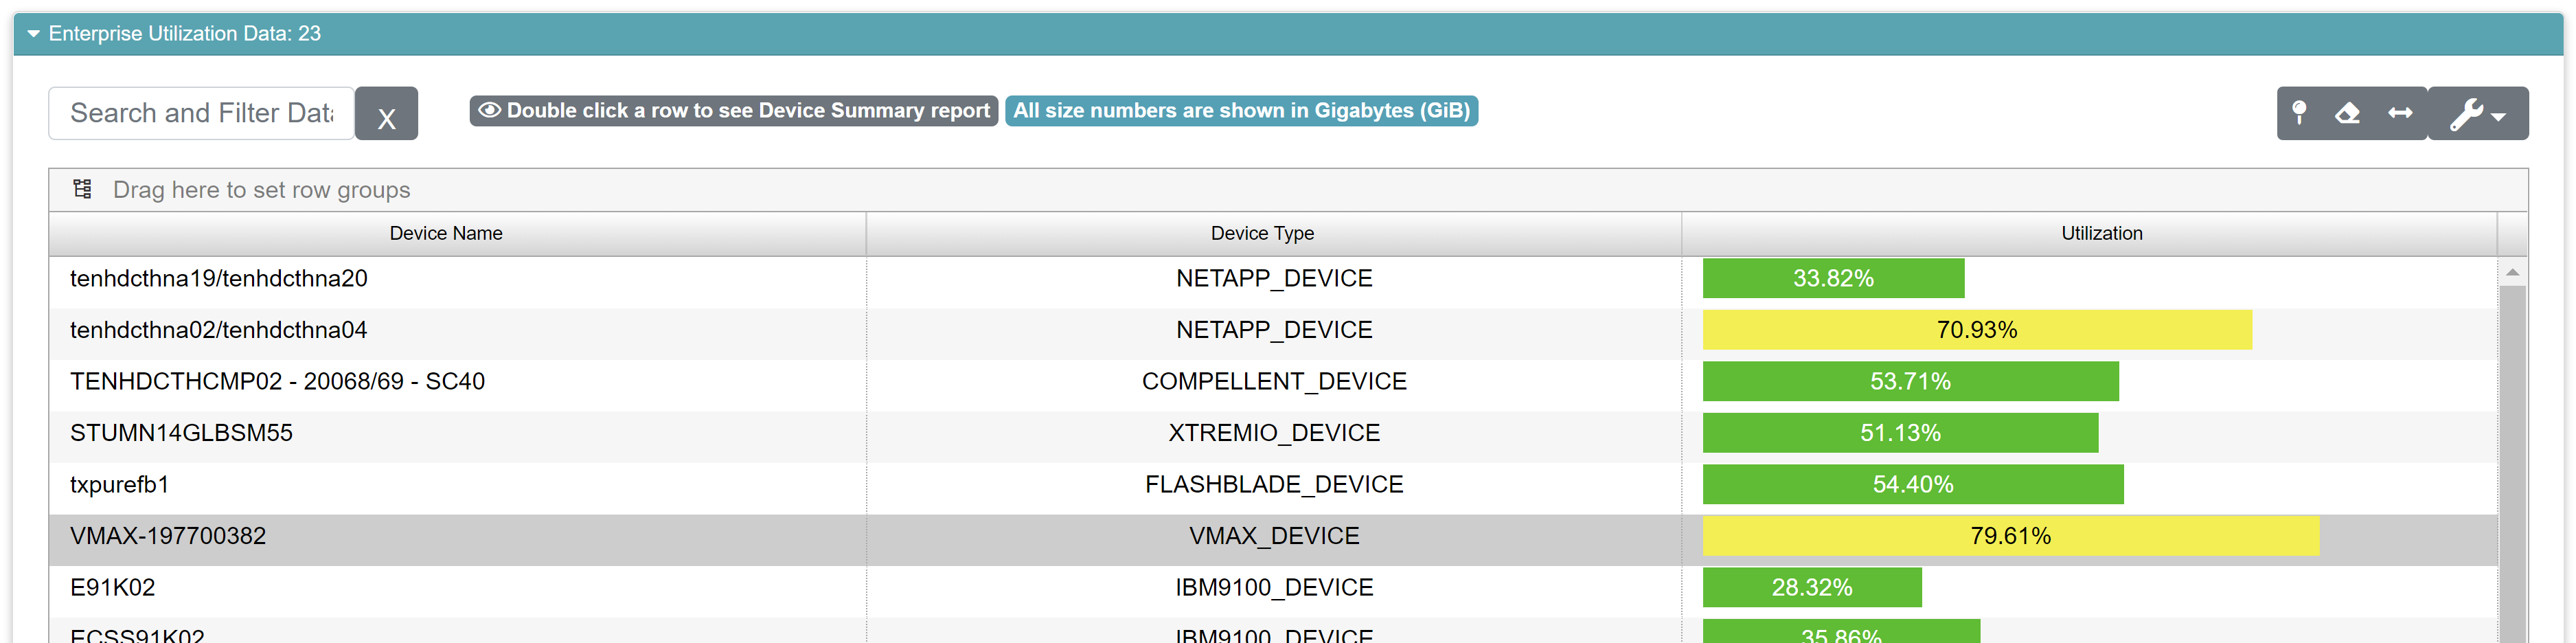
The Enterprise Utilization Report reflects the current utilization as a percentage for a reported device. The chart will also provide color indicators to alert the user if a device requires attention due to approaching thresholds. As the utilization approaches threshold, the color changes to yellow to warn you that you’re getting close, and red when the device is over the threshold. You can double-click a row on the report to see the device summary report for that row’s data.
Field |
What It Means |
How It’s Calculated |
|---|---|---|
Device Name |
The device name for the individual device represented on a given row. |
N/A |
Device Type |
The device type code for the device |
N/A |
Utilization |
The percentage of storage utilized. |
Used divided by usable |