The IT Dashboard provides a review of arrays by Business Units that have exceeded performance or capacity thresholds.
Storage Performance
Field |
What It Means |
|---|---|
MFG |
Manufacturer |
Array Name |
Storage Array Name |
Category |
Business Unit assigned to the array |
Application |
Name of the application on the array |
Resource Name |
Type of resource reporting (i.e. CPU, IO/Sec) |
Utilization % |
Percentage of the performance that is utilized |
Data Center |
Physical location of the server |
Collection Date |
Date the data was collected |
Storage Over Utilization
This report shows you your storage that has exceeded the capacity threshold defined in your organization’s client record. The default is 80%, so unless it was changed you’ll see a list of data stores and pools that have met or exceeded this threshold. Items between 80% and 90% are colored yellow. Over 90% is colored red. Any item at 100% utilization is dark blue.
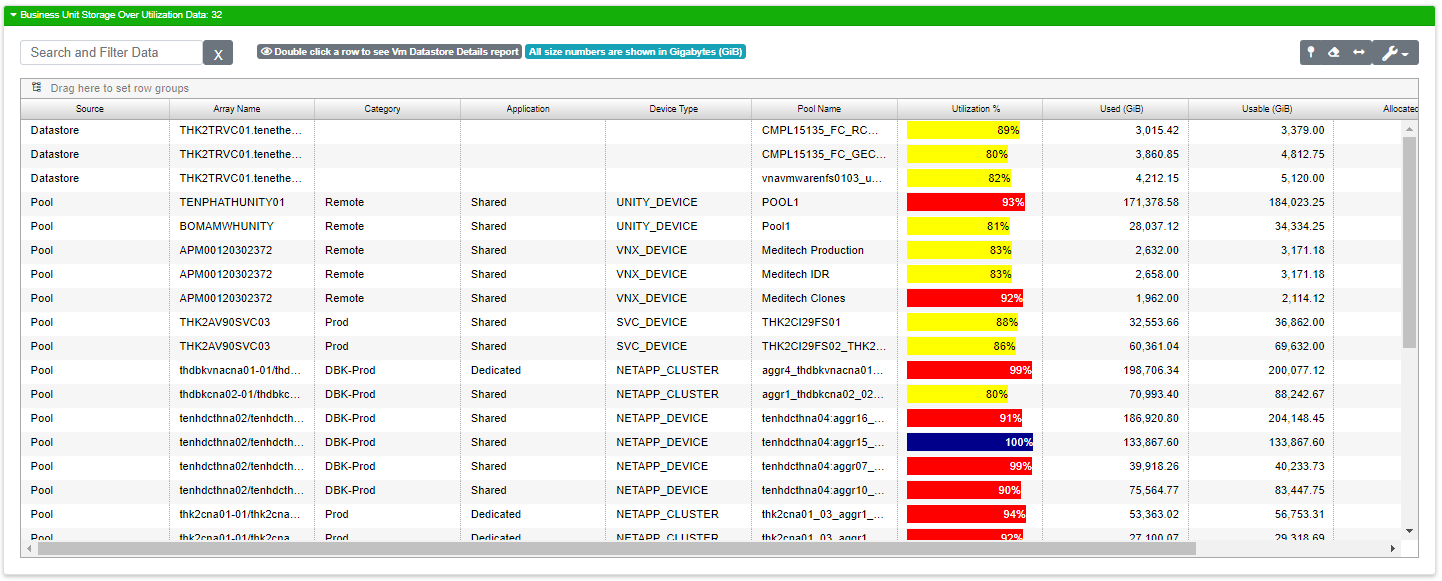
There isn’t a graph on this report besides the bars on Utilization %. Here’s the breakdown of the fields in the customizable data grid:
Field |
What It Means |
|---|---|
Category |
Business Unit assigned to the array |
Application |
Name of the application on the array |
Array Name |
Storage Array Name |
Pool Name |
Type of array pool reporting |
Utilization % |
Percentage of the array that is utilized |
Usable (GB) |
Total usable space in GB on the array |
Used (GB) |
Amount of GB used on the Array |
% Alloc |
Percentage of the server capacity that has been allocated to the Business Unit |
Data Center |
Physical location of the server |
Collection Date |
Date the data was collected |
Storage Over Provisioned
This report shows you a simple list of all your overprovisioned pools and data stores.
Field |
What It Means |
|---|---|
Source |
Tells you whether the line refers to a data store (virtual) or pool (physical) |
Array Name |
The name of the array where the pool / data store resides |
Device Type |
Refers to the device type of the array name. Data stores are going to be on a virtual type like VMWare. Pools will be on a physical device like NetApp. |
Classification |
Refers to the storage classification, such as block storage, file storage, etc. |
Pool Name |
The name of the pool or data store |
Allocated |
The amount of space allocated |
Allocated % |
The percentage of the allocation. On this report, everything will be above 100% allocation. |
Usable |
The amount of usable space within the pool / data store |
Used |
The amount of used space within the pool / data store |
Servers Over Threshold
This report gives you a view of your servers that have reached a set threshold in compute, memory or disk utilization. The obvious visual elements on this report are the percent utilization fields with color coded bars. Over threshold elements are colored red. Elements nearing threshold are yellow. Elements that area OK are green. At least one of the three utilization percentages (CPU, Memory, Disk) will be over threshold (red) in order to appear on this report.
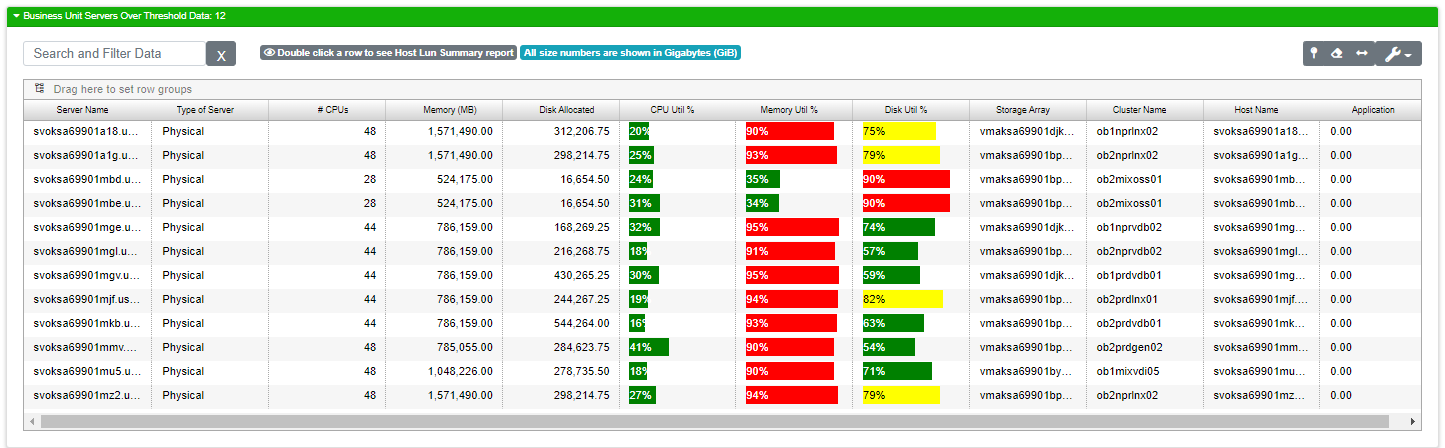
Field |
What It Means |
|---|---|
Server Name |
The name of the server |
Type of Server |
Physical or Virtual |
# CPU’s |
The total number of CPU’s available on the server |
Memory |
The total amount of memory in MB |
Disk Allocated |
The amount of storage space allocated. |
CPU Util % |
CPU Utilization Percentage. High percentages indicate a CPU that’s overworked. |
Memory Util % |
Memory utilization percentage. High memory usage can lead to paging which reduces overall compute performance. |
Disk Util % |
Let’s you know if you’re running low on storage space. |
Storage Array |
The name of the array for this line of the report |
Cluster Name |
The name of the cluster for this line of the report |
Host Name |
The name of the host for this line of the report |
Application |
The name of the application for this line of the report. This might indicate the source of the high utilization |
Servers Approaching Threshold
This report is similar to Serves Over Threshold, but it is designed to help you proactively review server resources that haven’t crossed the threshold yet, but will soon. In this report, one of the three utilization percentages needs to be within 10 percentage points of the threshold.
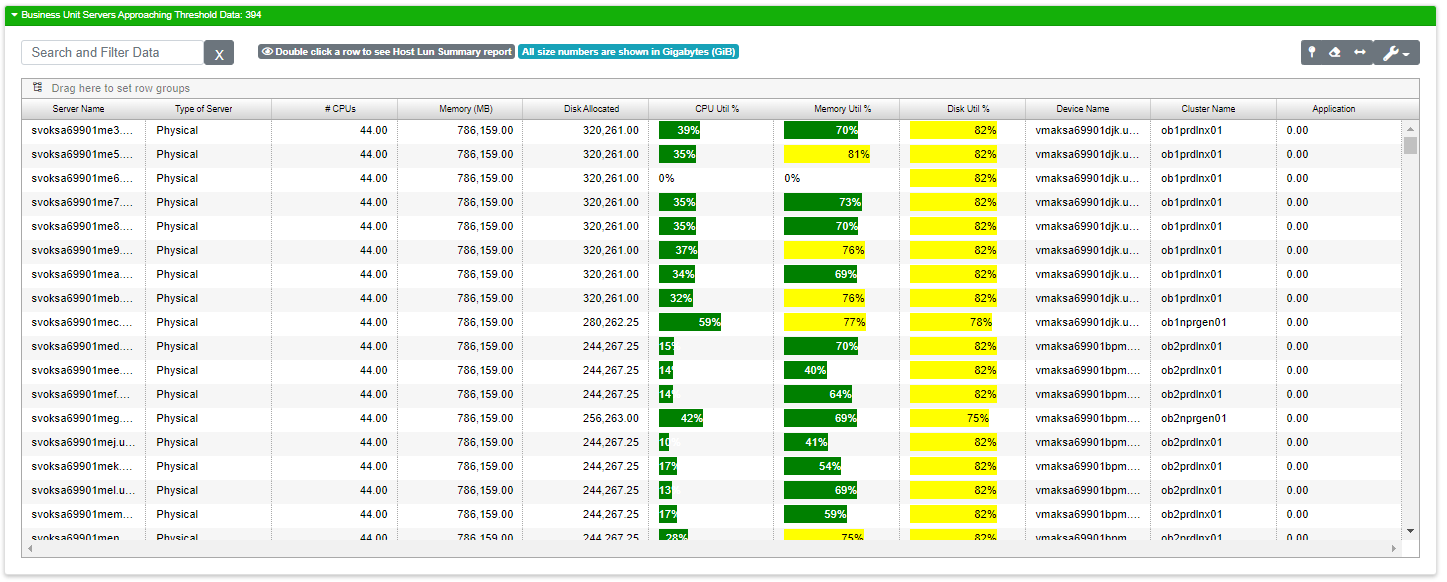
Field |
What It Means |
|---|---|
Server Name |
The name of the server |
Type of Server |
Physical or Virtual |
# CPU’s |
The total number of CPU’s available on the server |
Memory |
The total amount of memory in MB |
Disk Allocated |
The amount of storage space allocated. |
CPU Util % |
CPU Utilization Percentage. High percentages indicate a CPU that’s overworked. |
Memory Util % |
Memory utilization percentage. High memory usage can lead to paging which reduces overall compute performance. |
Disk Util % |
Let’s you know if you’re running low on storage space. |
Storage Array |
The name of the array for this line of the report |
Cluster Name |
The name of the cluster for this line of the report |
Host Name |
The name of the host for this line of the report |
Application |
The name of the application for this line of the report. This might indicate the source of the high utilization |
Virtual Clusters Over Capacity
This report refers specifically to your virtual clusters which are over capacity. This typically indicates a hypervisor that’s working too hard; beyond it’s overall capacity. You can use this report to determine which resources need to be moved or resized. There are three metrics of import here: CPU Build Capacity, Memory Build Capacity, and Disk Build Capacity. Each metric has it’s own threshold. Be default, CPU has a threshold of 80%. Memory is at 90% and Disk is at 80%. As a cluster nears these capacity levels the build capacity approaches zero. If any of the thresholds is exceeded, we generate a negative number for that metric. You can think of it this way: given your current utilization, what is the biggest new VM you could possible make? If the CPU, memory, or disk build capacities are 0 or lower the answer is “none” because a VM needs compute, memory and storage to function. Given a hypervisor’s ability to overprovision, much like you can with thin-provisioned storage, you can overallocate and this report tells you where these overallocations exist.
Field |
What It Means |
|---|---|
Cluster Name |
Name of the cluster for this line of the report |
vCenter Name |
Name of the VMWare VCenter server hosting the cluster |
Build Capacity (VM) |
The lowest number of the set comprised of CPU Build Capacity, Memory Build Capacity and Disk Build Capacity. In order to make this report, this number must be negative. |
CPU Build Capacity (VM) |
The number of CPU’s that could be supported by the addition of a new VM |
Memory Build Capacity (VM) |
The amount of memory that could be supported with the addition of a new VM |
Disk Build Capacity (VM) |
The amount of space allocation that could be supported with the addition of a new VM. |