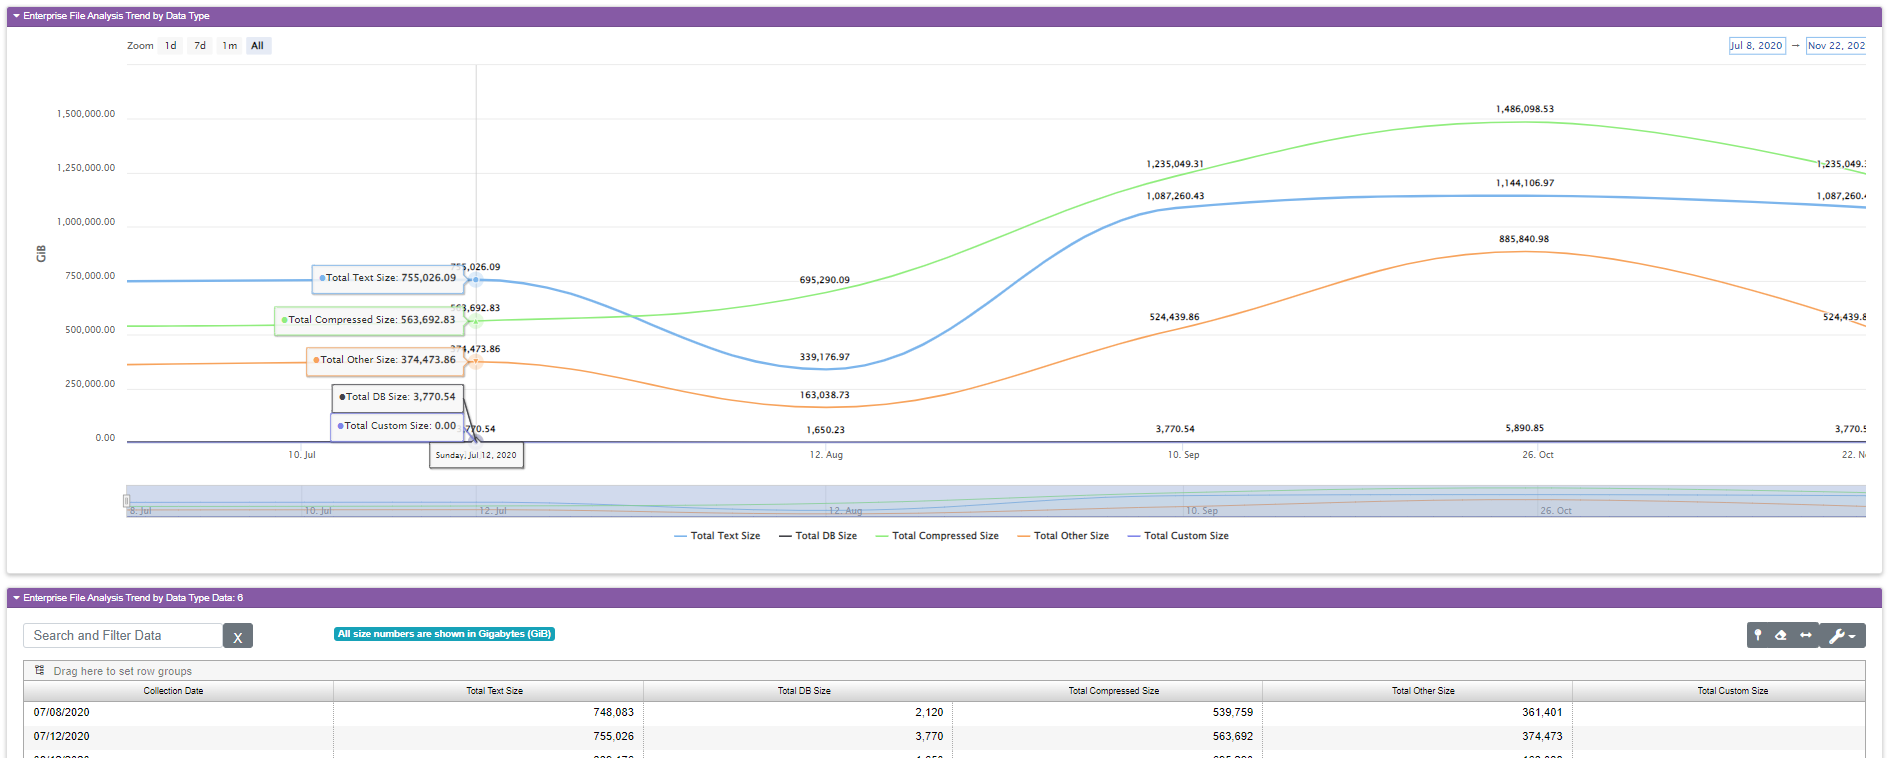
This collection of trend reports are collectively the same data we’ve seen so far, but graphed over time. This helps you spot useful trends in how your storage is used at department and user levels. Our storage reports show you what is being used, and how much. This set of reports shows how the storage is used, and it shows how that usage changes over time.
Enterprise File Analysis Trend by Data Type
This report shows you utilization trends over time for the types of data in the files on the share. This is done by mapping common file extensions such as .docx for a Microsoft Word document or .zip for a standard compressed file.
Field |
What It Means |
|---|---|
Collection Date |
The date for the data on that line of the grid |
Total Text Size |
The total size on that date of all text files. Text files are any form of textual data, not just .txt files. They include files created in office suites. |
Total DB Size |
The total size on that date of all database files. Database files will include desktop database files like those created in Microsoft Access or SQLite, as well as server database files like those created by SQL Server or Oracle. |
Total Compressed Size |
The total size on that date of all compressed files. For this one, we’re talking about compressed with the kind of compression software used by business users like PKZip (.zip files), 7Zip (.7z), tar files, etc. |
Total Other Size |
The total size on that date of all files with extensions we couldn’t identify as text, database, AV, or compressed. It’s basically “everything else”. |
Total Custom Size |
Each VSI client has the ability to configure a list of custom file extensions to be included in the file reports as “Custom”. If you’ve done this, the total size of files captured will appear for that particular date. If you haven’t set up a custom set, this column will be blank and the graph line will be flat at 0. Setting up custom buckets is optional. |
File Trend by Share
This report shows the utilization trend by share. It allows you to see which shares are growing and which are not.
In this example we can see the share called N:/public is growing over time while the others are clearly not moving which might lead to a discussion on why they are stagnant.
Field Name |
What It Means |
|---|---|
Share Name |
The name of the share where the data were collected |
Collection Date |
The date the data were collected |
Total Share Size |
The total size of the share computed by summing the size of all files on the share. |
Enterprise File Analysis by Owner
This report has been discontinued. There isn’t a good way to collect this data that works consistently in Windows, Unix and Linux, and this data might contain personally identifiable information in the form of user names which we’re rather avoid.
Enterprise File Analysis Trend by Access / Update
This report shows the utilization trend on a given share over time expressed in terms of time buckets. For example, files created within the last 30 days are totaled in the 30 day bucket. Files that are between one and two years old in terms of when they were created or accessed (updated).
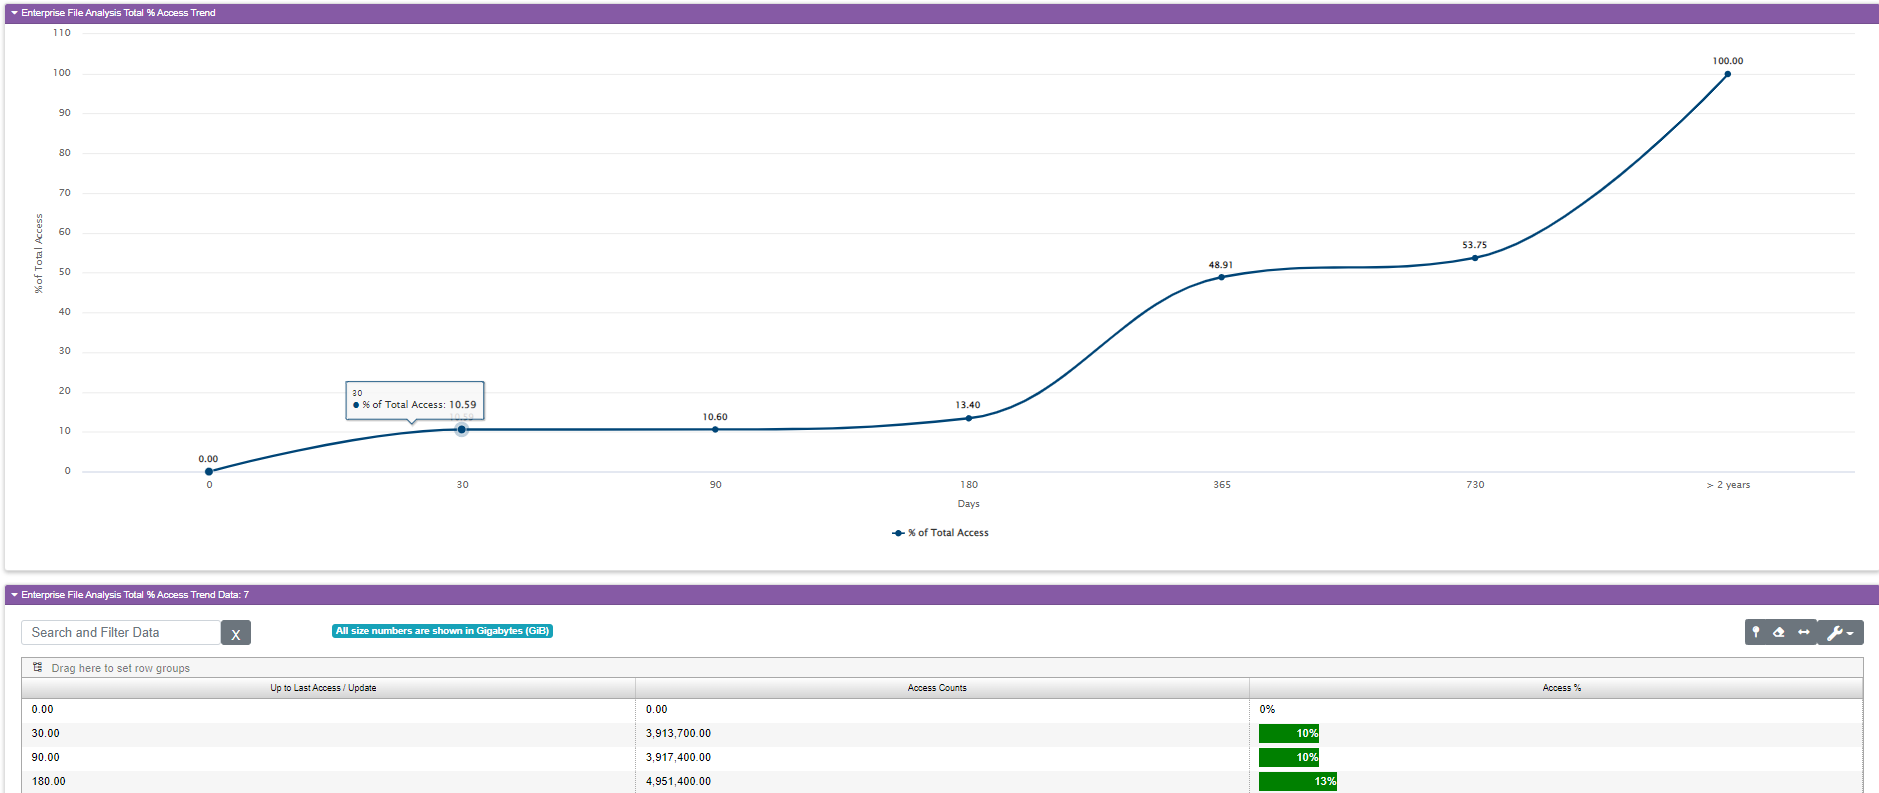
Enterprise File Analysis Total % Access Trend
This report is designed to show you a cumulative line graph of our utilization time buckets. It’s not a trend chart by date like most other trend charts in VSI. Instead this one draws the curve from total percentage of access. What you’re looking for here is the “knee” in the curve. In our example below, you can see it in the 365-day bucket. Most file access data has a shape like this and that bump tells you where the biggest benefit might be for setting a threshold and deciding when files are too old (i.e. not used regularly) to be justified worthy of taking up space. In this example the bump at the 365-day bucket tells me it makes the most sense to archive or move files that haven’t been used in over a year. Every organization is different, so the bump will be in different places for different companies.
Enterprise Potential Savings
This report is all about saving money by moving less often used files to the cloud. The cost calculations are not meant to be precise since the cost of cloud storage fluctuates. This is more of an estimate based on an average fixed cost. At the top of the report is a column chart with a group for each file type (text, database, AV, compressed, etc.). The column shows you your costs before moving and after. Usually the “after” number is significantly cheaper by several orders of magnitude.
Unstructured Data Reporting
This is a new reporting feature in VSI. It isn’t generally available yet.


