When you look at a used storage statistic for any given array the first thing that often pops into your head, especially as those utilization bars creep from green to yellow to red, indicating the array is filling up, is “Which among these files are necessary and which are not?” Sometimes the best way to find out is to review the last time those files were accessed. The Enterprise File Analysis by Last Update is designed to tell you whether or not hunting around for old files is worthwhile. This report shows you a breakdown of how much space is used within your enterprise by the last time the files were updated or created. During data collection, our collection script scans the file share and it looks at the date the file was last modified. We call these date ranges buckets. Each bucket will contain files that were created or modified within the time period for that bucket. For example, the 30-day bucket contains data on files created or accessed within the last 30 days. Those are likely the most important files on your share because it shows they’re being used. In contrast, the yellow 730-day bucket contains files created or accessed between 360 and 730 days. Basically, they’re over a year old and nobody is accessing them. We count the files in each bucket and add up their size to bring you this report. We further break them down by file type so you can see what kind of files you’re storing.
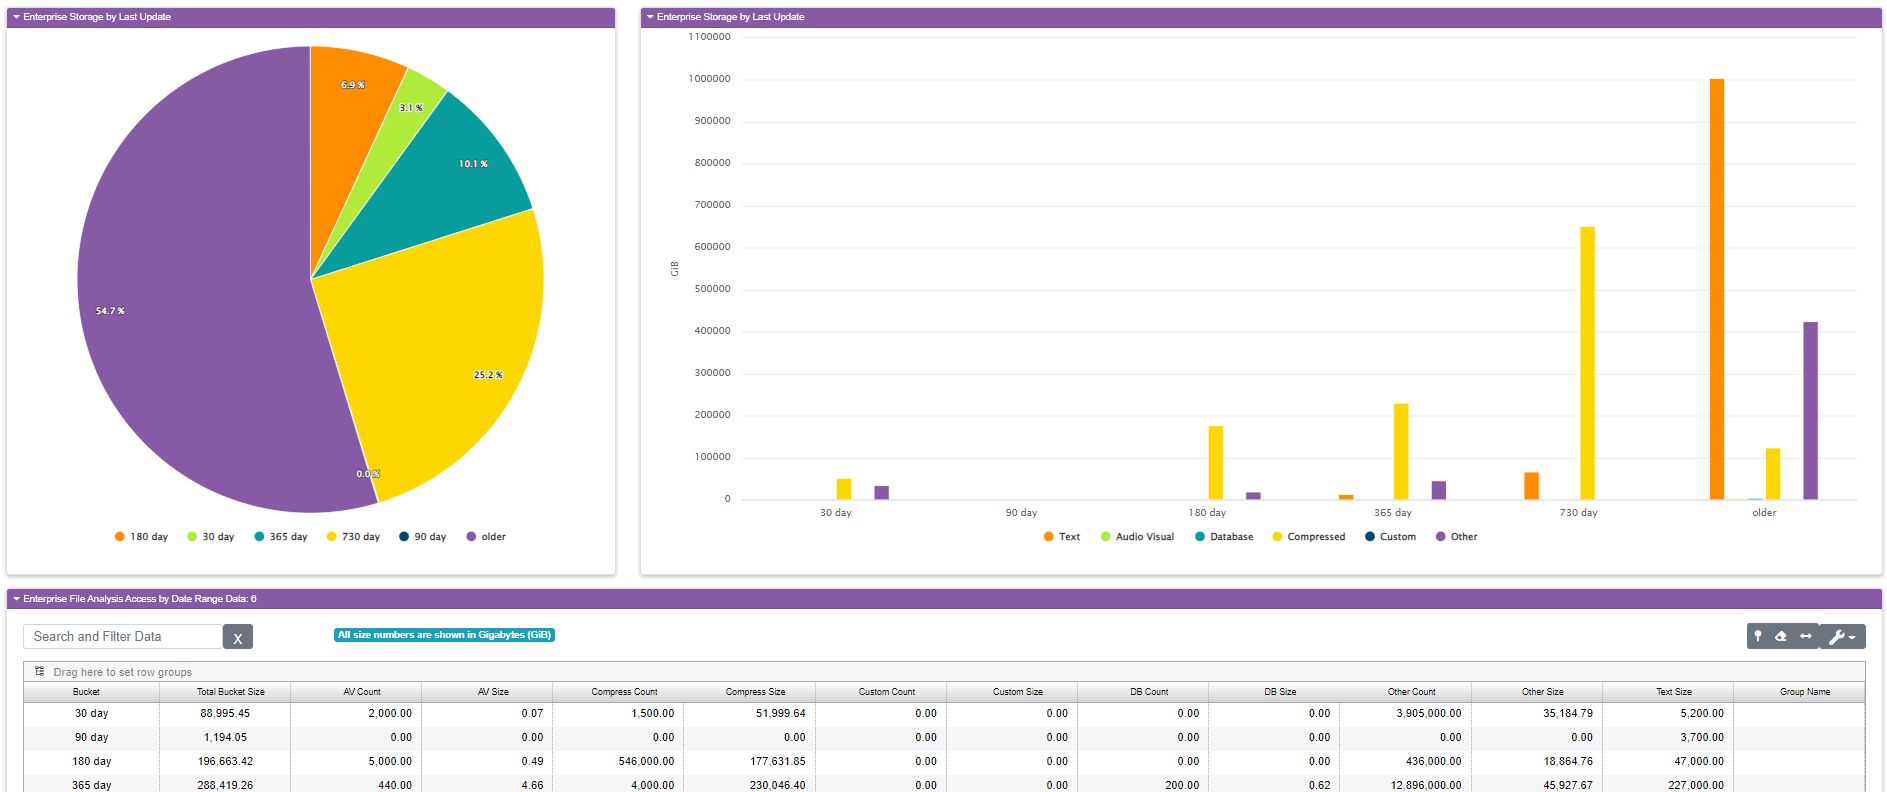
The report is split into three parts. At the top left is a pie chart showing you how much of your space is consumed by files grouped by age since their last use. In the example above you can see 54% of our space is used by files that have not been accessed in two years or more, and another 25%, represented by the yellow 730 day bucket, haven’t been accessed in the last year. Effectively we’re saying 80% of our share is old files that nobody is using. This kind of information can be crucial when deciding when it’s time to expand your storage. Are you paying for an expensive flash system to store files nobody uses? Could you move some of the old stuff off to a cloud storage provider like Amazon S3 or Azure Blob Storage, both of which offer glacial file storage with a very small cost compared to adding drawers to your arrays?
Next to the pie chart is the same data in column format. It’s the same data with a different view so you can see the buckets by type a little more clearly. While we have trend charts for all these breakdowns you can see some interesting trends on the column chart too. I can see that 3 years ago all the people in the office that uses this share probably used it for everything. See how high the orange column is? Those are office files like word processing documents, spreadsheets, and presentations. The 730-day bucket is significantly smaller but the compressed files, which are files like zip and tar files. The closer you get to the 30-day bucket the less we see those text files. So where are our users storing their work files now? Did they stop using the share, which is backed up, secured, and auditable in favor of just working on their laptop’s hard drive? Did everybody start using a service like DropBox or Google Drive? Does that mean we can migrate this and re-purpose this storage for something else?
The file analysis reports surface these kinds of information so you can have meaningful discussions with your storage team as well as your business users. Without these reports you might be wasting valuable resources or worse, buying storage might not need.
The last element in the report is of course the data used to generate the graph. It’s at the bottom in a customizable data grid.
Field |
What It Means |
|---|---|
Share Name |
The name of the share |
Total Share Size |
The size of the share |
Text Size |
The total size of all text and text-like files such as those created by an office suite of tools like Microsoft Office |
Text Count |
The total number of all text and text-like files such as those created by an office suite of tools like Microsoft Office |
AV Size |
The total size of all audio-visual files on that share |
AV Count |
The total count of all audio-visual files on the share |
DB Size |
The total size of all database files on the share |
DB Count |
The total count of all database files on the share |
Compressed Size |
The total size of all compressed files like zip, tar, 7z, etc. |
Compressed Count |
The total number of compressed files found on the share |
Other Size |
The total size of files scanned that didn’t fit any other classification |
Other Count |
The total count of files scanned that didn’t fit any other classification |
Custom Size |
Total size of files found that match the custom criteria set up by each customer (optional) |
Custom count |
Total count of files found that match the custom criteria set up by each customer (optional) |
Group Name |
The owner of the share within your organization. This is not used in the present release and will likely be taken out in the next release. |